Features · real time
Real-time analytics: who is on your site now
Real-time analytics with two honest clocks. Visitors are counted every 2 minutes, with the same rules as every other figure. Requests are read every 15 seconds and always called requests.
Real-time analytics shows what is happening on a website right now: who is on it, what they read and where they came from. Skald reads it from the end of your server's access log, so AI assistants and crawlers show too, in their own units. Part of Skald features.
30-day free trial · no card · we set it up within one working day · free to self-host
- 14:02:10 Visitors as of 14:02:10counted every 2 min
- 14:03:45 Requests as of 14:03:45read every 15 s
- Active now · 14 visitorspeople
- Last 30 minutes · 61 visitorspeople
- Requests this minute · 412requests, not people
- ChatGPT-User · 9 requests, 30 minAI · live fetch
Sample figures. People and requests, each on its own clock and in its own unit.
[01] two clocks
Real-time visitors every 2 minutes, requests every 15 seconds
A raw request is not a person. So Real time shows two figures, each with its own clock at the top of the page, and never mixes them.
Visitors, counted every 2 minutes
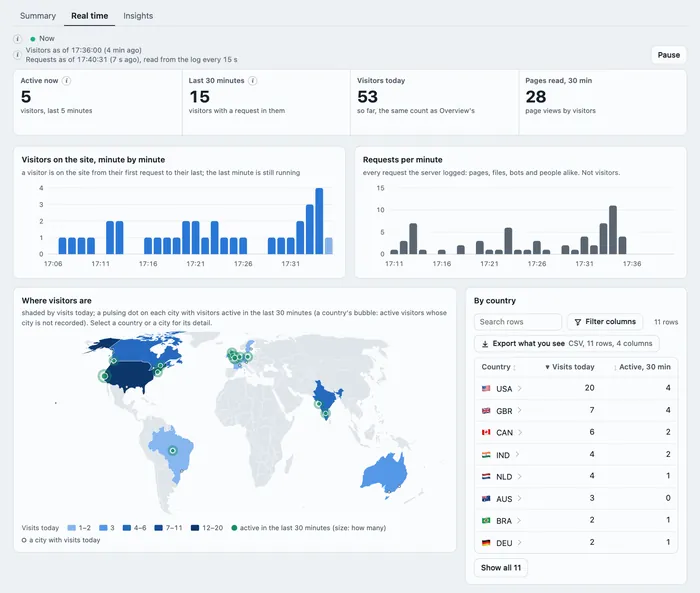
The people figures: active now (a request in the last 5 minutes), the last 30 minutes, today so far, and pages read in the last 30 minutes. Counted with the same rules as every other figure, so a crawler pretending to be a browser, your own office and the heartbeat are never in them.
If the clock says late, the 2-minute count has not run for more than 10 minutes, and Site › Data quality says why.
Requests, read every 15 seconds
Every request your server logged in each minute: pages, images, scripts, bots and people alike, read from the end of the log. They are not sorted into people and machines yet, so they are always called requests.
A spike here with no visitors is usually a crawler. Pause holds everything still; Resume starts again.
Sample figures. The left one is people, the right one is log lines.
[02] the live map
A live world map of your visitors, down to the city
Each country is shaded by its visits today. A green bubble marks a country with visitors active in the last 30 minutes.
With a city file, a pulsing dot sits on each city with someone on the site now, and a hollow dot marks a city with visits today and nobody active. Point at one for its figures, click it for its detail. The By country and By city tables beside it hold the same figures, to search, sort and download.
The map is drawn in the page from Natural Earth's public-domain outlines. No map service is asked for anything.
[03] what they are doing
What visitors are doing now, page by page
On Overview with Today · Live on: the five visitors with the newest activity, where they are, their device, where they came from, and the pages they read in order.
As visitors move, a new page joins their path, a new visitor slides in at the top, and one who has gone quiet fades out. Point at a row and its city pulses on the map. Select one to open the visitor drawer with its journey.
- Toronto · Mobile · from chatgpt.com/ → /pricing/ → /book-a-demo/
- Lyon · Desktop · from google.com/blog/log-analytics/ → /docs/
- Austin · Desktop · Direct/pricing/
- now on /book-a-demo/ · 20 s agoToronto, from chatgpt.com
Sample visitors. No address and no browser string is shown here.
[04] today against yesterday
Today so far against yesterday at this hour
At 14:33 today, each tile is set against yesterday from midnight to 14:33. Never against all of yesterday, which would make every morning look like a fall.
Sample figures. Under 10 yesterday, the change is a count (+2); from 10, a percent.
Its own second count
Yesterday is counted again from the log up to the same time, every 2 minutes, with today's rules. Leads come from the lead store, test rows left out.
Not recorded, never a fall
If yesterday was withheld, only partly in the log, or not recorded, the change says Not recorded. It never shows as a drop to zero.
A running total by hour
The small chart under each tile is today as a line and yesterday dashed. Point at it for the totals at each hour.
[05] the lists
Pages, sources, devices and AI, right now
Under the map, four lists for the last 30 minutes. Select any page, source, device or crawler to open its detail.
Pages being read
Page views in the last 30 minutes, by page.
Newest visits
The ten newest, with time, city or country, device, source, landing page and pages so far. "Active now" means a request in the last 5 minutes.
Sources and devices now
Visitors active in the last 30 minutes, by where they came from and by device.
AI and crawlers now
Requests from AI assistants and search crawlers by name, other bots and scanners as one count. Machines, in requests.
[06] checked, even live
Real-time figures, counted twice
Every real-time figure is counted a second time from the raw log lines, along with yesterday at this hour and the last 15-second request count.
If the second count of today disagrees, today's figures are withheld and Real time shows no visitor figures until they match. The request count stays: it is a plain count of log lines.
What it does not do
- Visitor figures refresh every 2 minutes, not every 15 seconds. The 15-second figure is requests, never people.
- Real time always covers the whole site, never one page group. On a page group, yesterday at this hour says not recorded.
- Cities need a city file set by whoever runs your Skald server. Without one, the map shows countries only.
- Lines that reach the log late, from a log shipper say, reach Real time late too.
- In the live demo there is no running Skald, so its requests per minute come from the 2-minute count, and it says so.
keep reading
More on real-time analytics
questions
Real-time analytics FAQ
Straight answers, including what Skald does not do.
How often does Skald's real-time view update?
It has two clocks. The visitor figures are counted every 2 minutes, with the same rules as every other figure, so crawlers, your own office and the heartbeat are never in them. Requests per minute are read from the end of the log every 15 seconds. The page asks for fresh figures every 15 seconds while it is open.
Why does Skald say requests and not visitors for the 15-second figure?
Because those lines are not sorted into people and machines yet. One page can make many requests, and a crawler makes requests too. A spike in requests with no visitors is usually a crawler. Skald never calls a request a visitor.
What does active now mean?
A visitor with any request in the last 5 minutes. A visitor is a visit that read a page, the same count as Visitors everywhere else in the dashboard, and an upper bound on people.
Does the live map use an outside map service?
No. The map is drawn in the page from Natural Earth's public-domain outlines. No map service is asked for anything. Countries are shaded by visits today, and with a city file, each city with someone on the site in the last 30 minutes gets a pulsing dot.
Can I see AI assistants in real time?
Yes. AI and crawlers now lists requests from AI assistants and search crawlers in the last 30 minutes, by name, with other bots and scanners as one count. They are machines, counted in requests, never as visitors.
What happens if the real-time figures do not add up?
Every real-time figure is counted a second time from the raw log lines. If that second count of today disagrees, Real time shows no visitor figures until they match. The request count stays, because it is a plain count of log lines.
$ tail -f access.log | skald
See what AI does with your site. Free for 30 days.
No card. We set up hosted Skald for you within one working day, or you self-host it free. Every line of your log, sorted and added up.